Our approach to risk
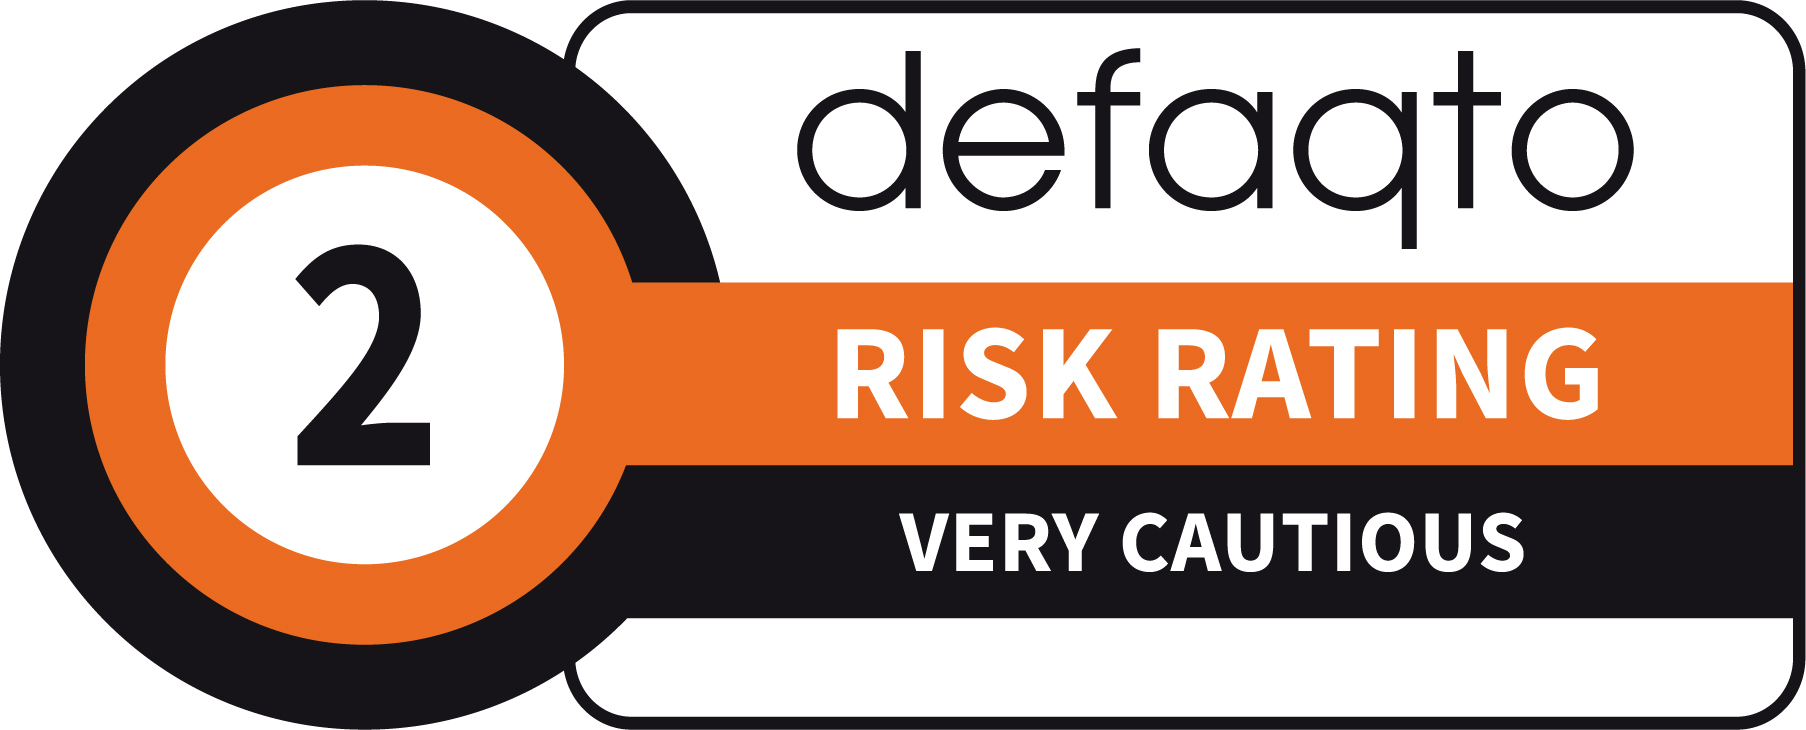
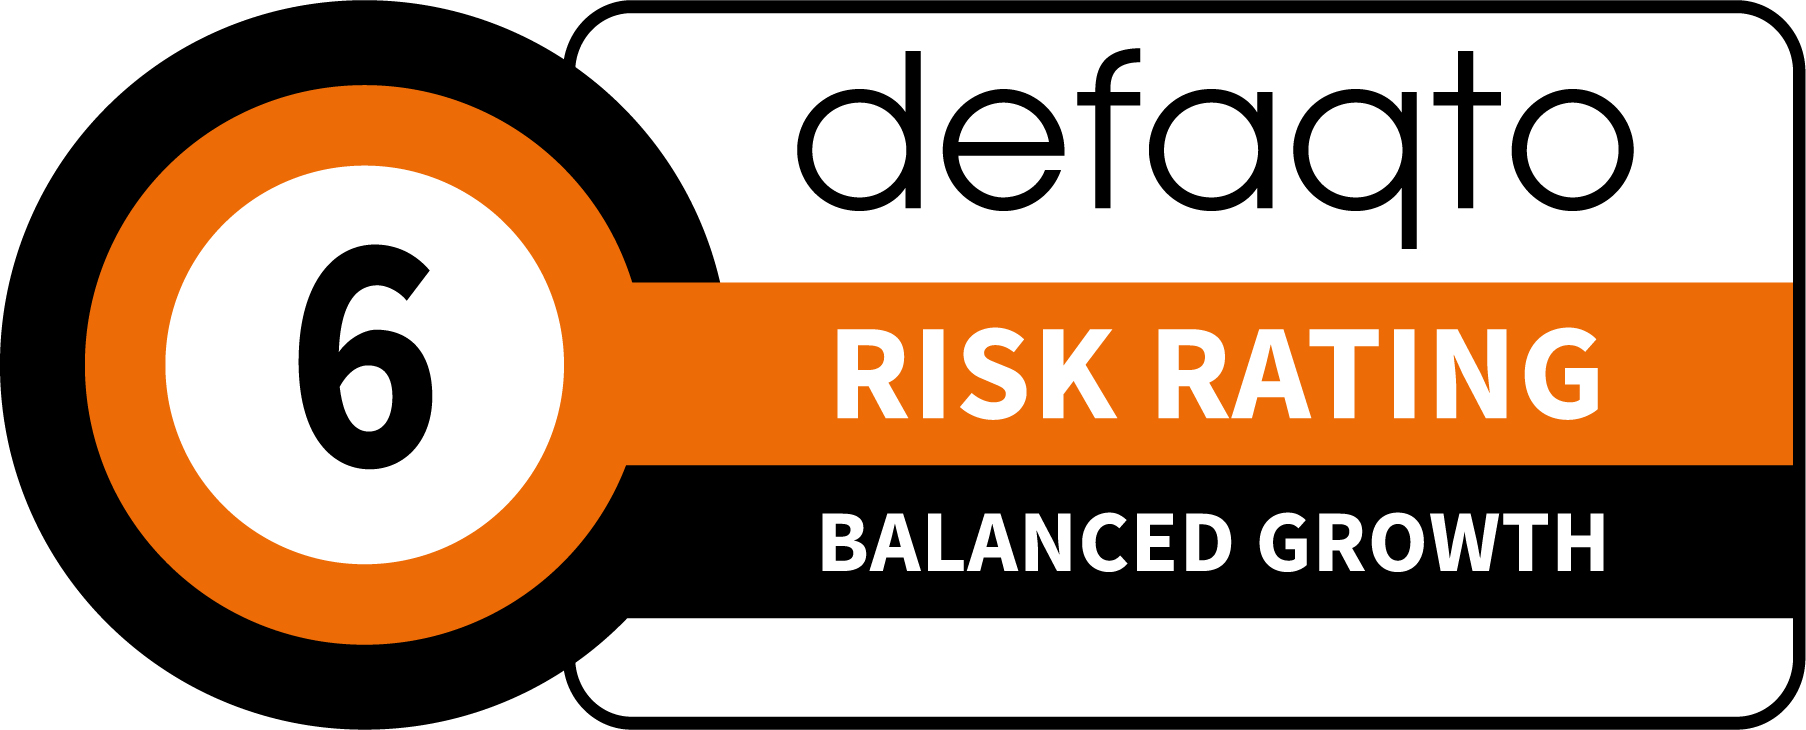
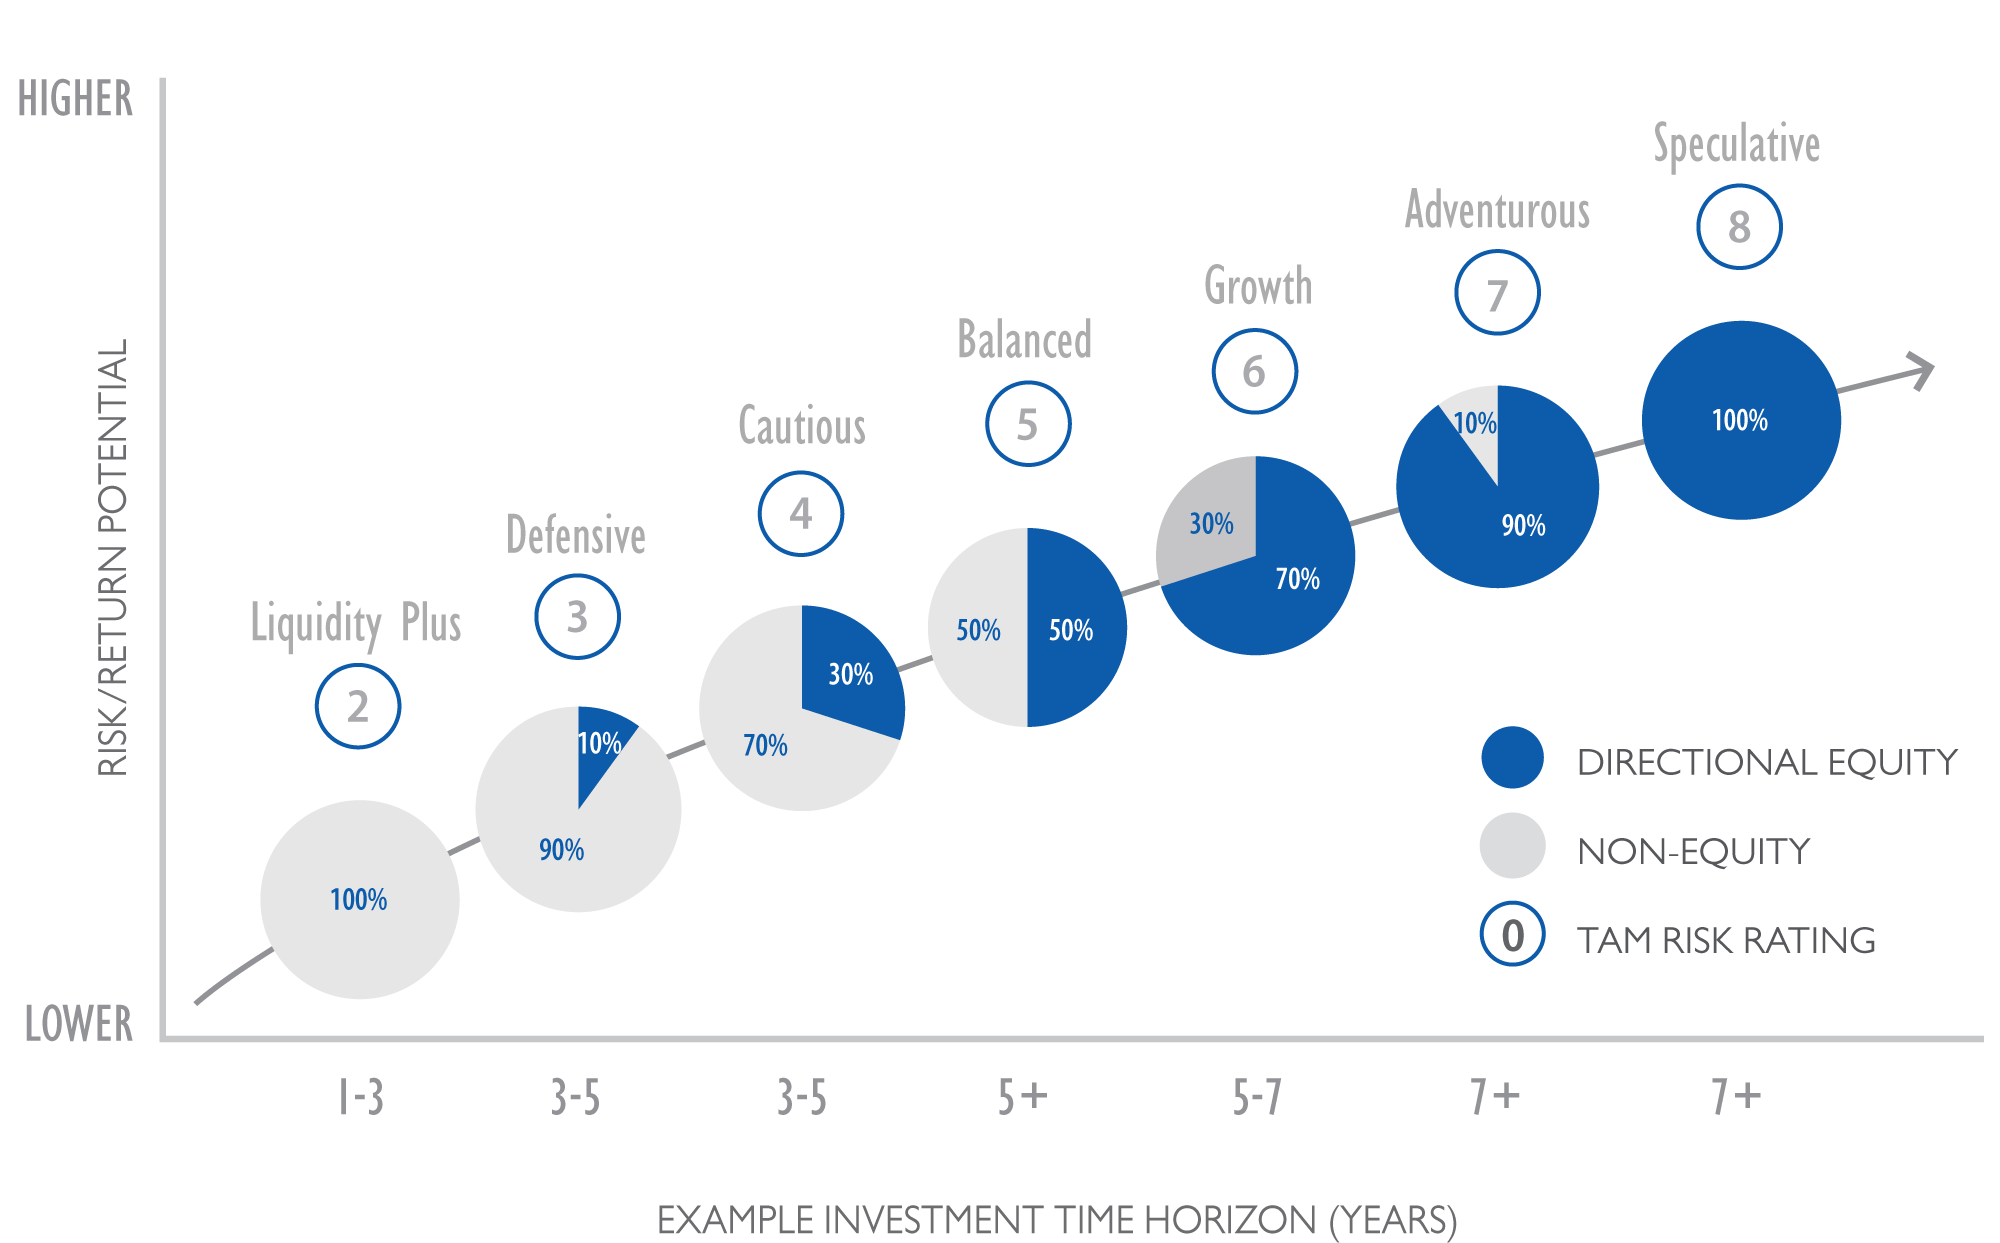
Clients can select an investment portfolio that most closely reflects their investment return objectives and attitude to risk. We offer seven Defaqto risk-rated model portfolio options, ranging from defensive lower risk returns, through to higher risk equity-based returns.
Liquidity Plus
This model seeks to generate a return moderately higher than cash over the short term (1-3 years or more) while maintaining very low volatility and a high level of liquidity. Portfolios will comprise 100% non-equity investments, though weightings may deviate within set parameters, allowing our managers to react to market conditions.
Defensive
This model seeks to generate modest returns higher than cash in the bank over the short to medium term (3 to 5 years or more) with potential for consistent though constrained capital growth. Portfolios will typically comprise 10% equity and 90% non-equity - though weightings may deviate within set parameters, allowing our managers to react to market conditions.
Cautious
This model seeks to generate modest capital growth higher than bond based returns over the short to medium term (3 to 5 years or more) by employing a more cautious investment strategy. Portfolios will typically comprise 30% equity and 70% non-equity - though weightings may deviate within set parameters, allowing our managers to react to market conditions.
Balanced
This model seeks to generate capital growth over the medium term (5 years or more), with the aim of riding out short-term fluctuations in value. Portfolios will typically comprise 50% equity and 50% non-equity - though weightings may deviate within set parameters, allowing managers to react to market conditions.
Growth
This model seeks to generate higher capital growth over the medium to long term (5 to 7 years or more) by employing a more dynamic investment strategy. Portfolios will typically comprise 70% equity and 30% non-equity - though weightings may deviate within set parameters, allowing managers to react to market conditions.
Adventurous
This model seeks to generate strong capital growth over the long term (7 years or more) and can experience potentially frequent and higher levels of volatility than Premier Growth. Portfolios will typically comprise 90% equity and 10% non-equity - though weightings may deviate within set parameters, allowing managers to react to market conditions.
Speculative
This model seeks to generate aggressive capital growth over the long term (7 years or more) and can experience very high levels of volatility in both the short and longer term. Portfolios will typically comprise 100% equity - though weightings may deviate within set parameters, allowing managers to react to market conditions.
The diagram is for illustrative purposes only. The value of investments, and the income from it, may go down as well as up and may fall below the amount initially invested. Weightings may deviate from these levels at the Investment Team's discretion whilst staying within specific guidelines, so the above asset allocation is intended as a guide only.


